Monitoring
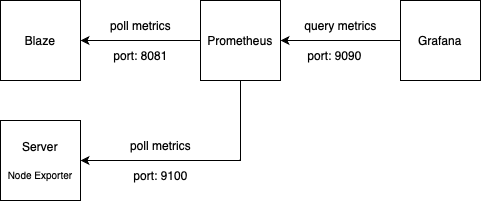
It's recommended to use Prometheus and Grafana to monitor the runtime behaviour of Blaze and of the server Blaze runs on.

Prometheus Config
A basic Prometheus config looks like this:
yaml
global:
  scrape_interval: 15s

scrape_configs:
- job_name: 'node'
  static_configs:
  - targets: ['<server-ip-addr>:9100']
  - labels:
      instance: 'blaze'

- job_name: 'blaze'
  static_configs:
  - targets: ['<server-ip-addr>:8081']
  - labels:
      instance: 'blaze'
Import the Blaze Dashboard
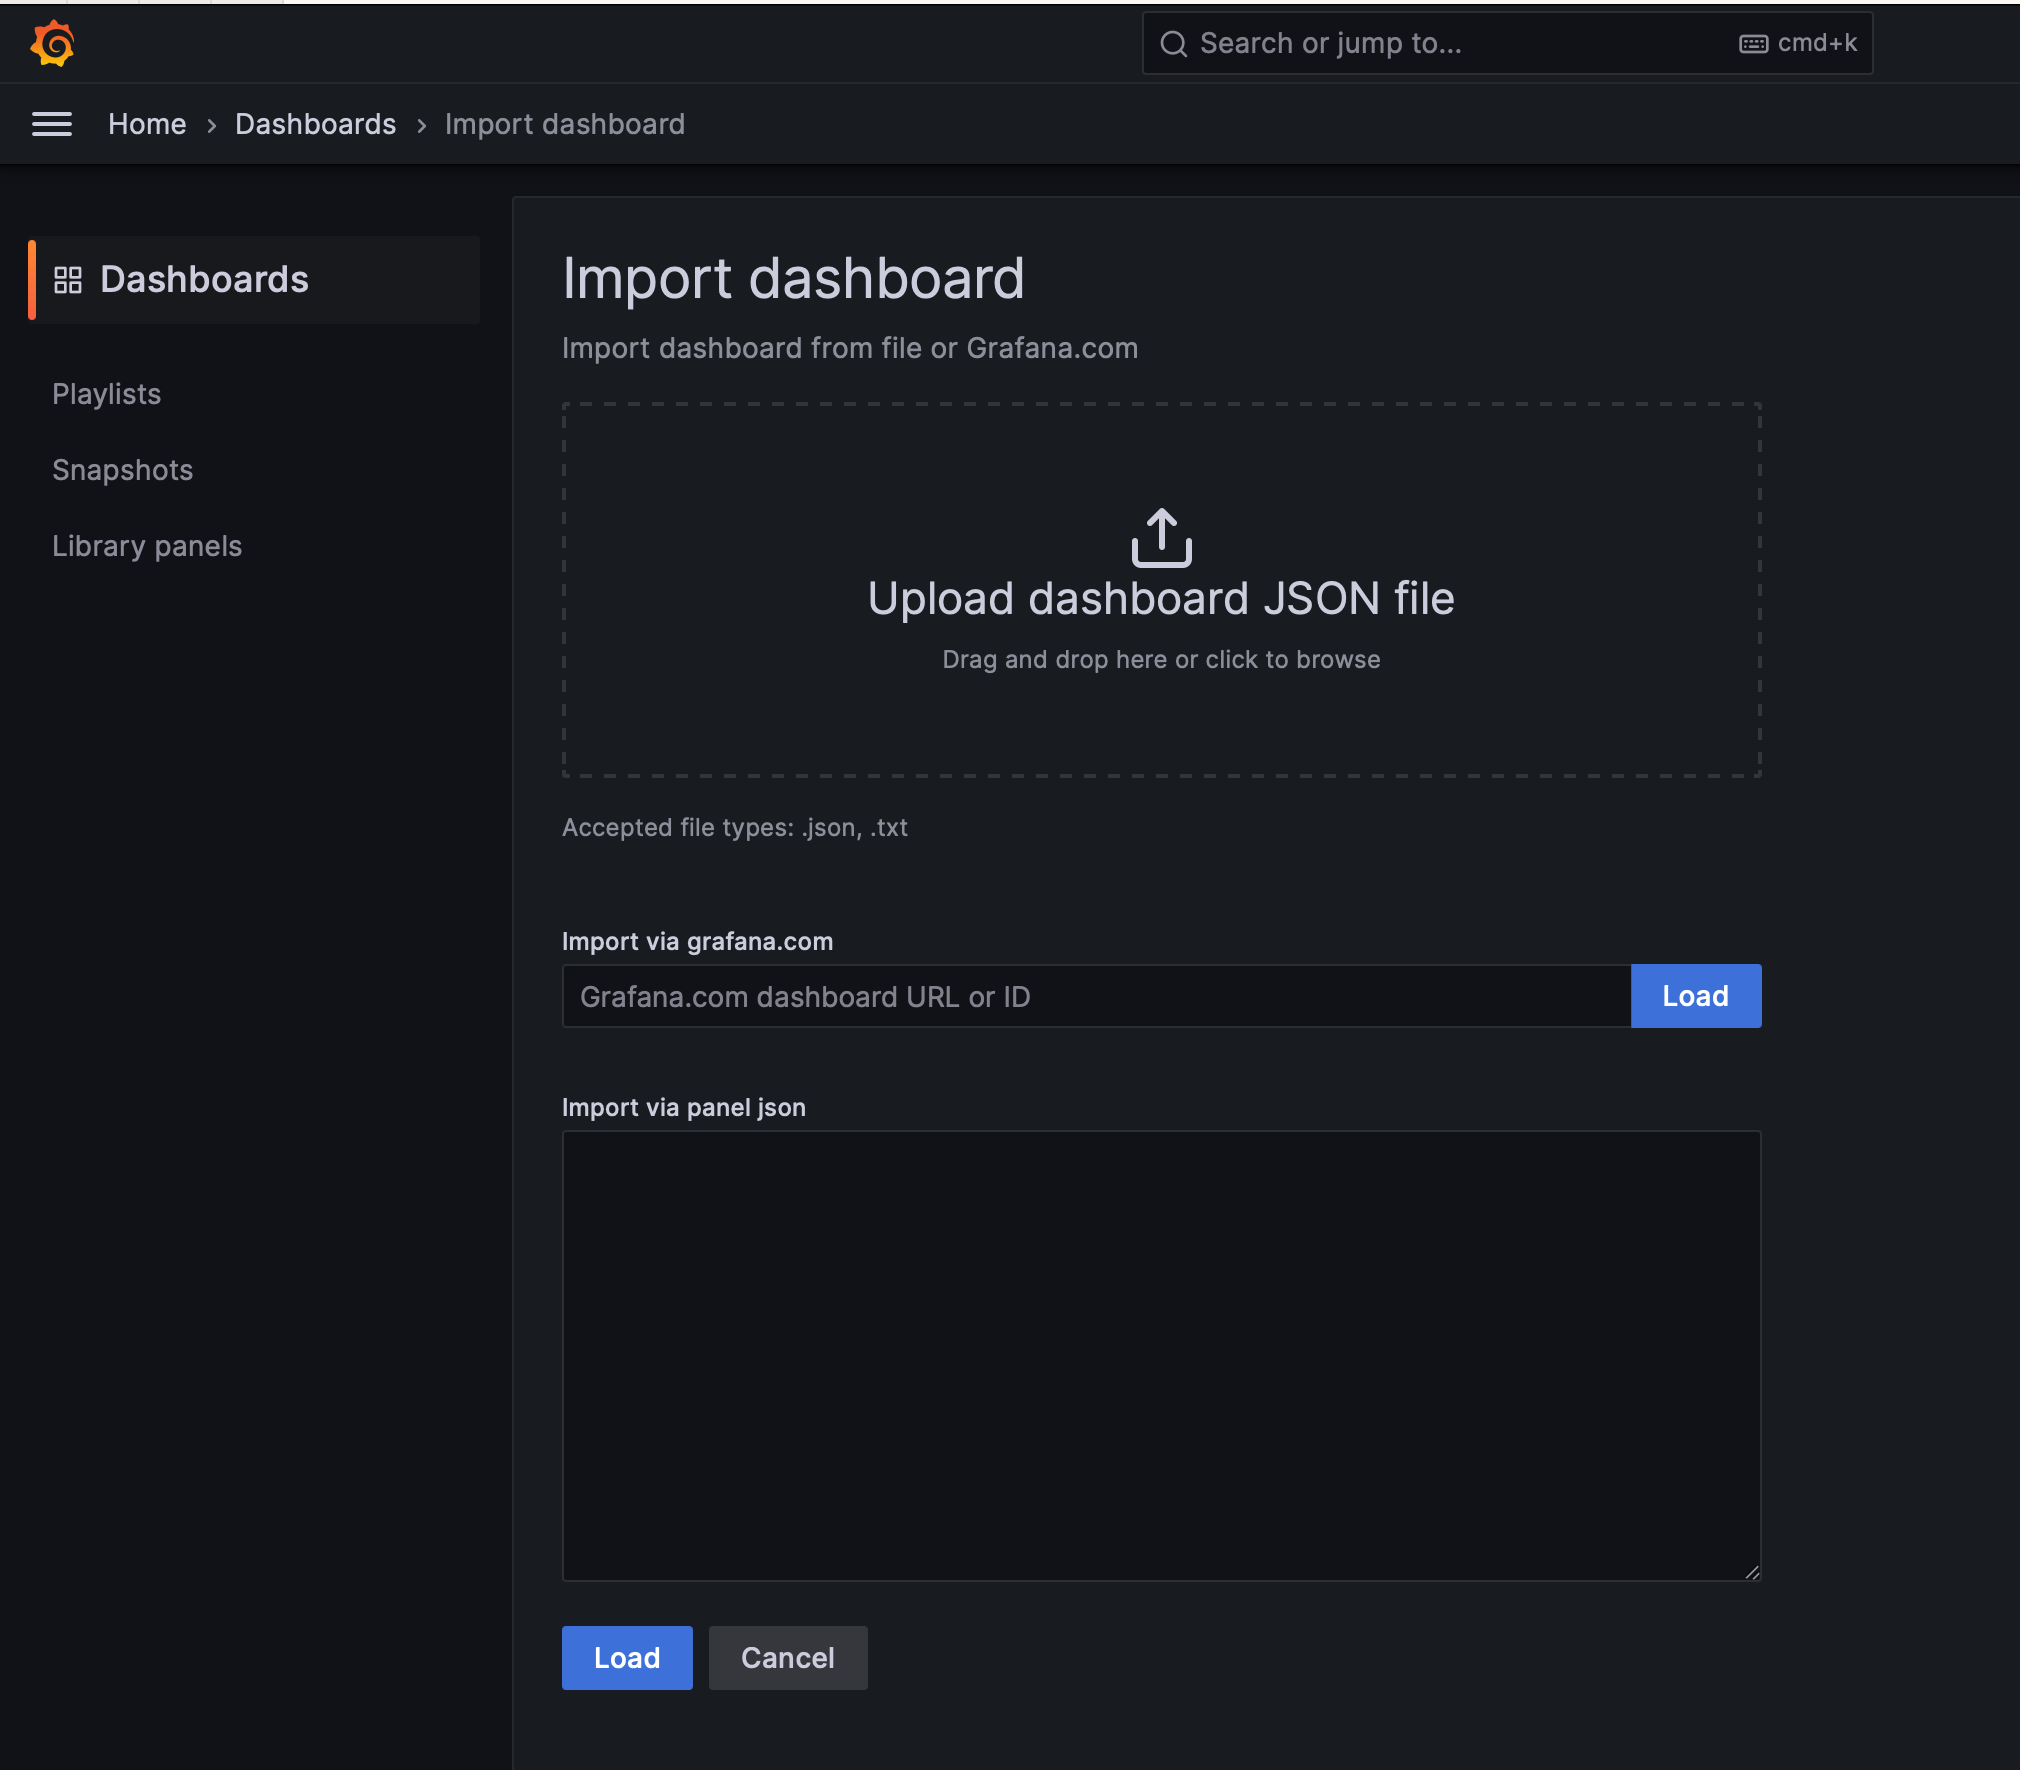
In order to import the Blaze dashboard into your Grafana instance, please copy the contents of blaze.json and paste it into the import dialog on the Import dashboard site:

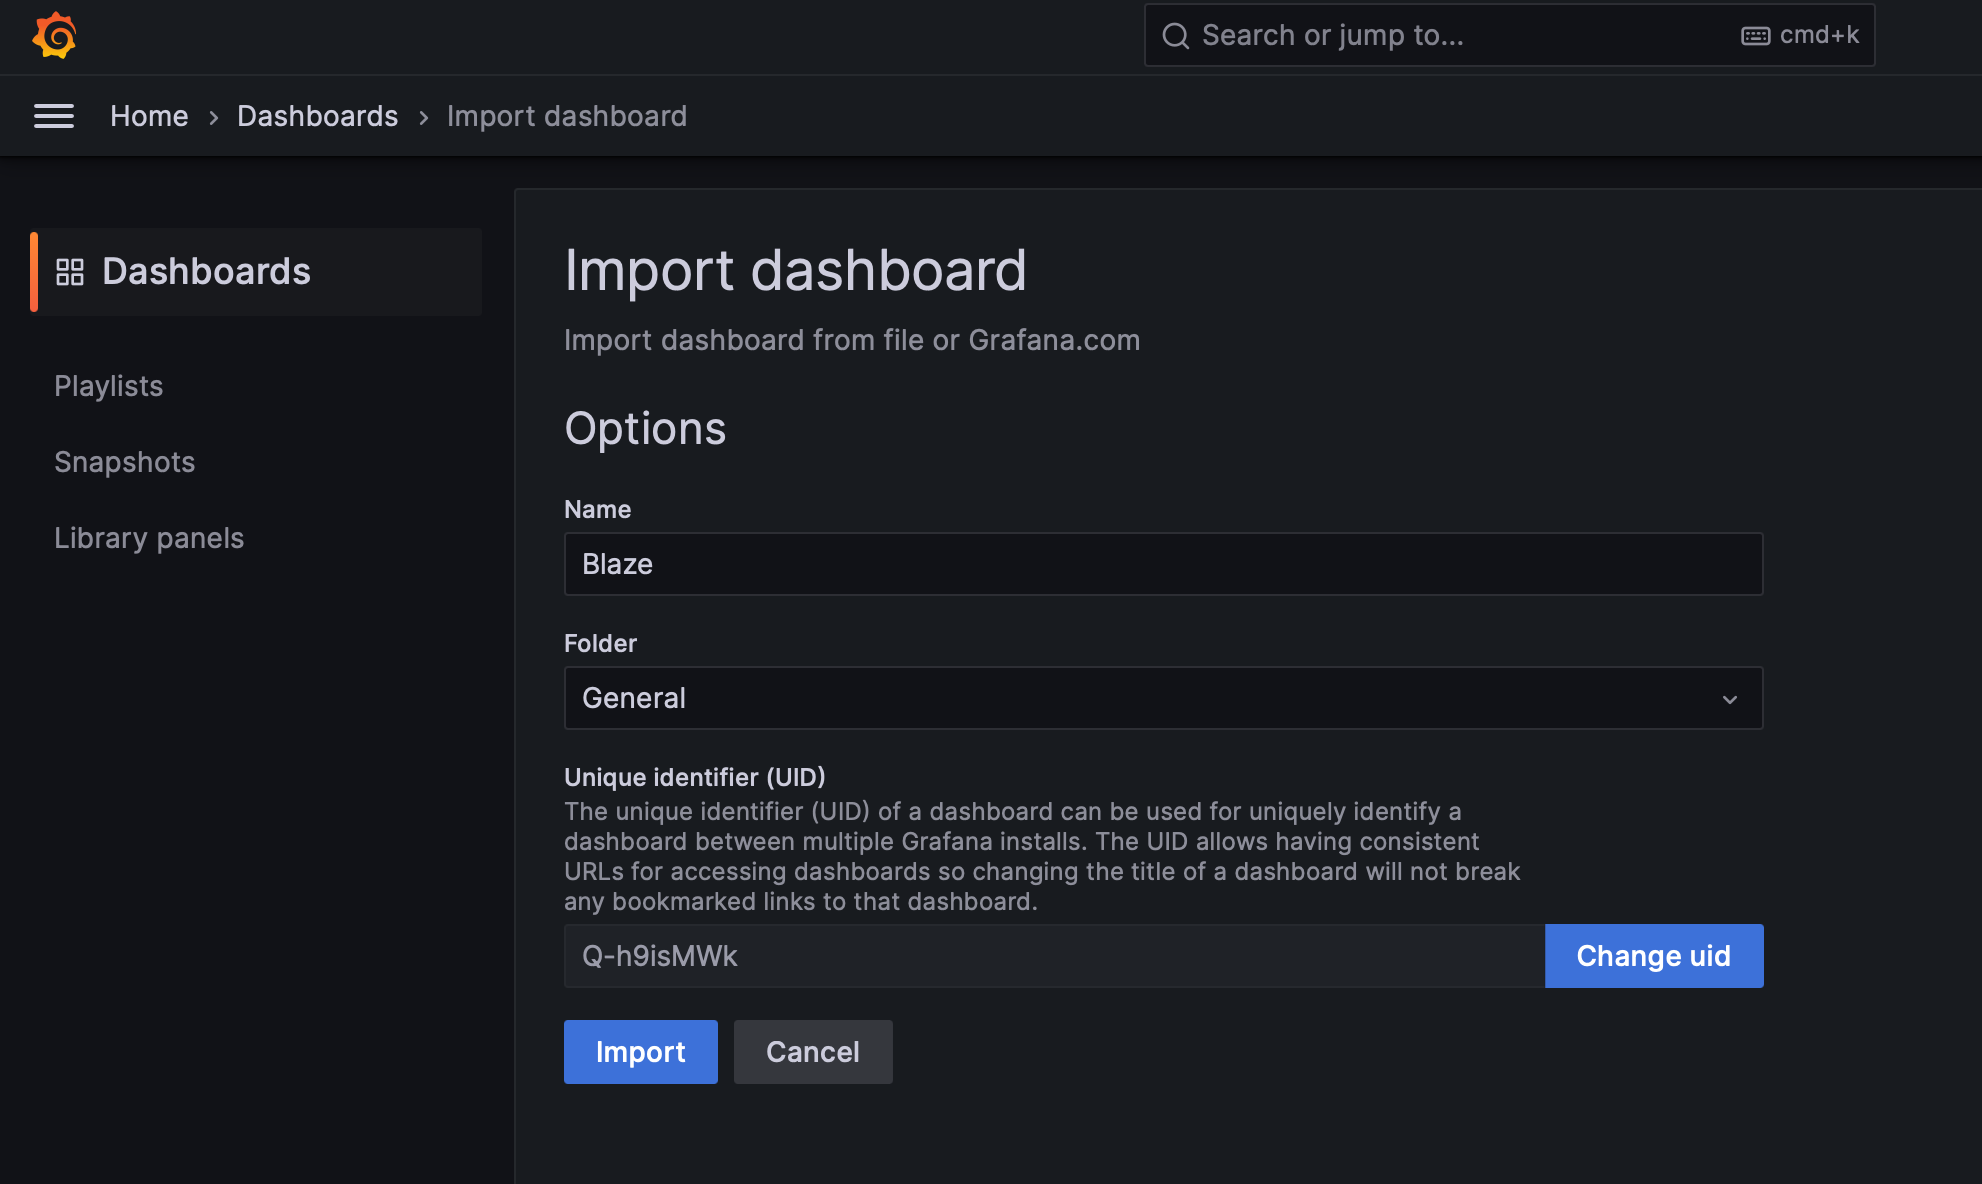
After that, please click "Import" on the next site:

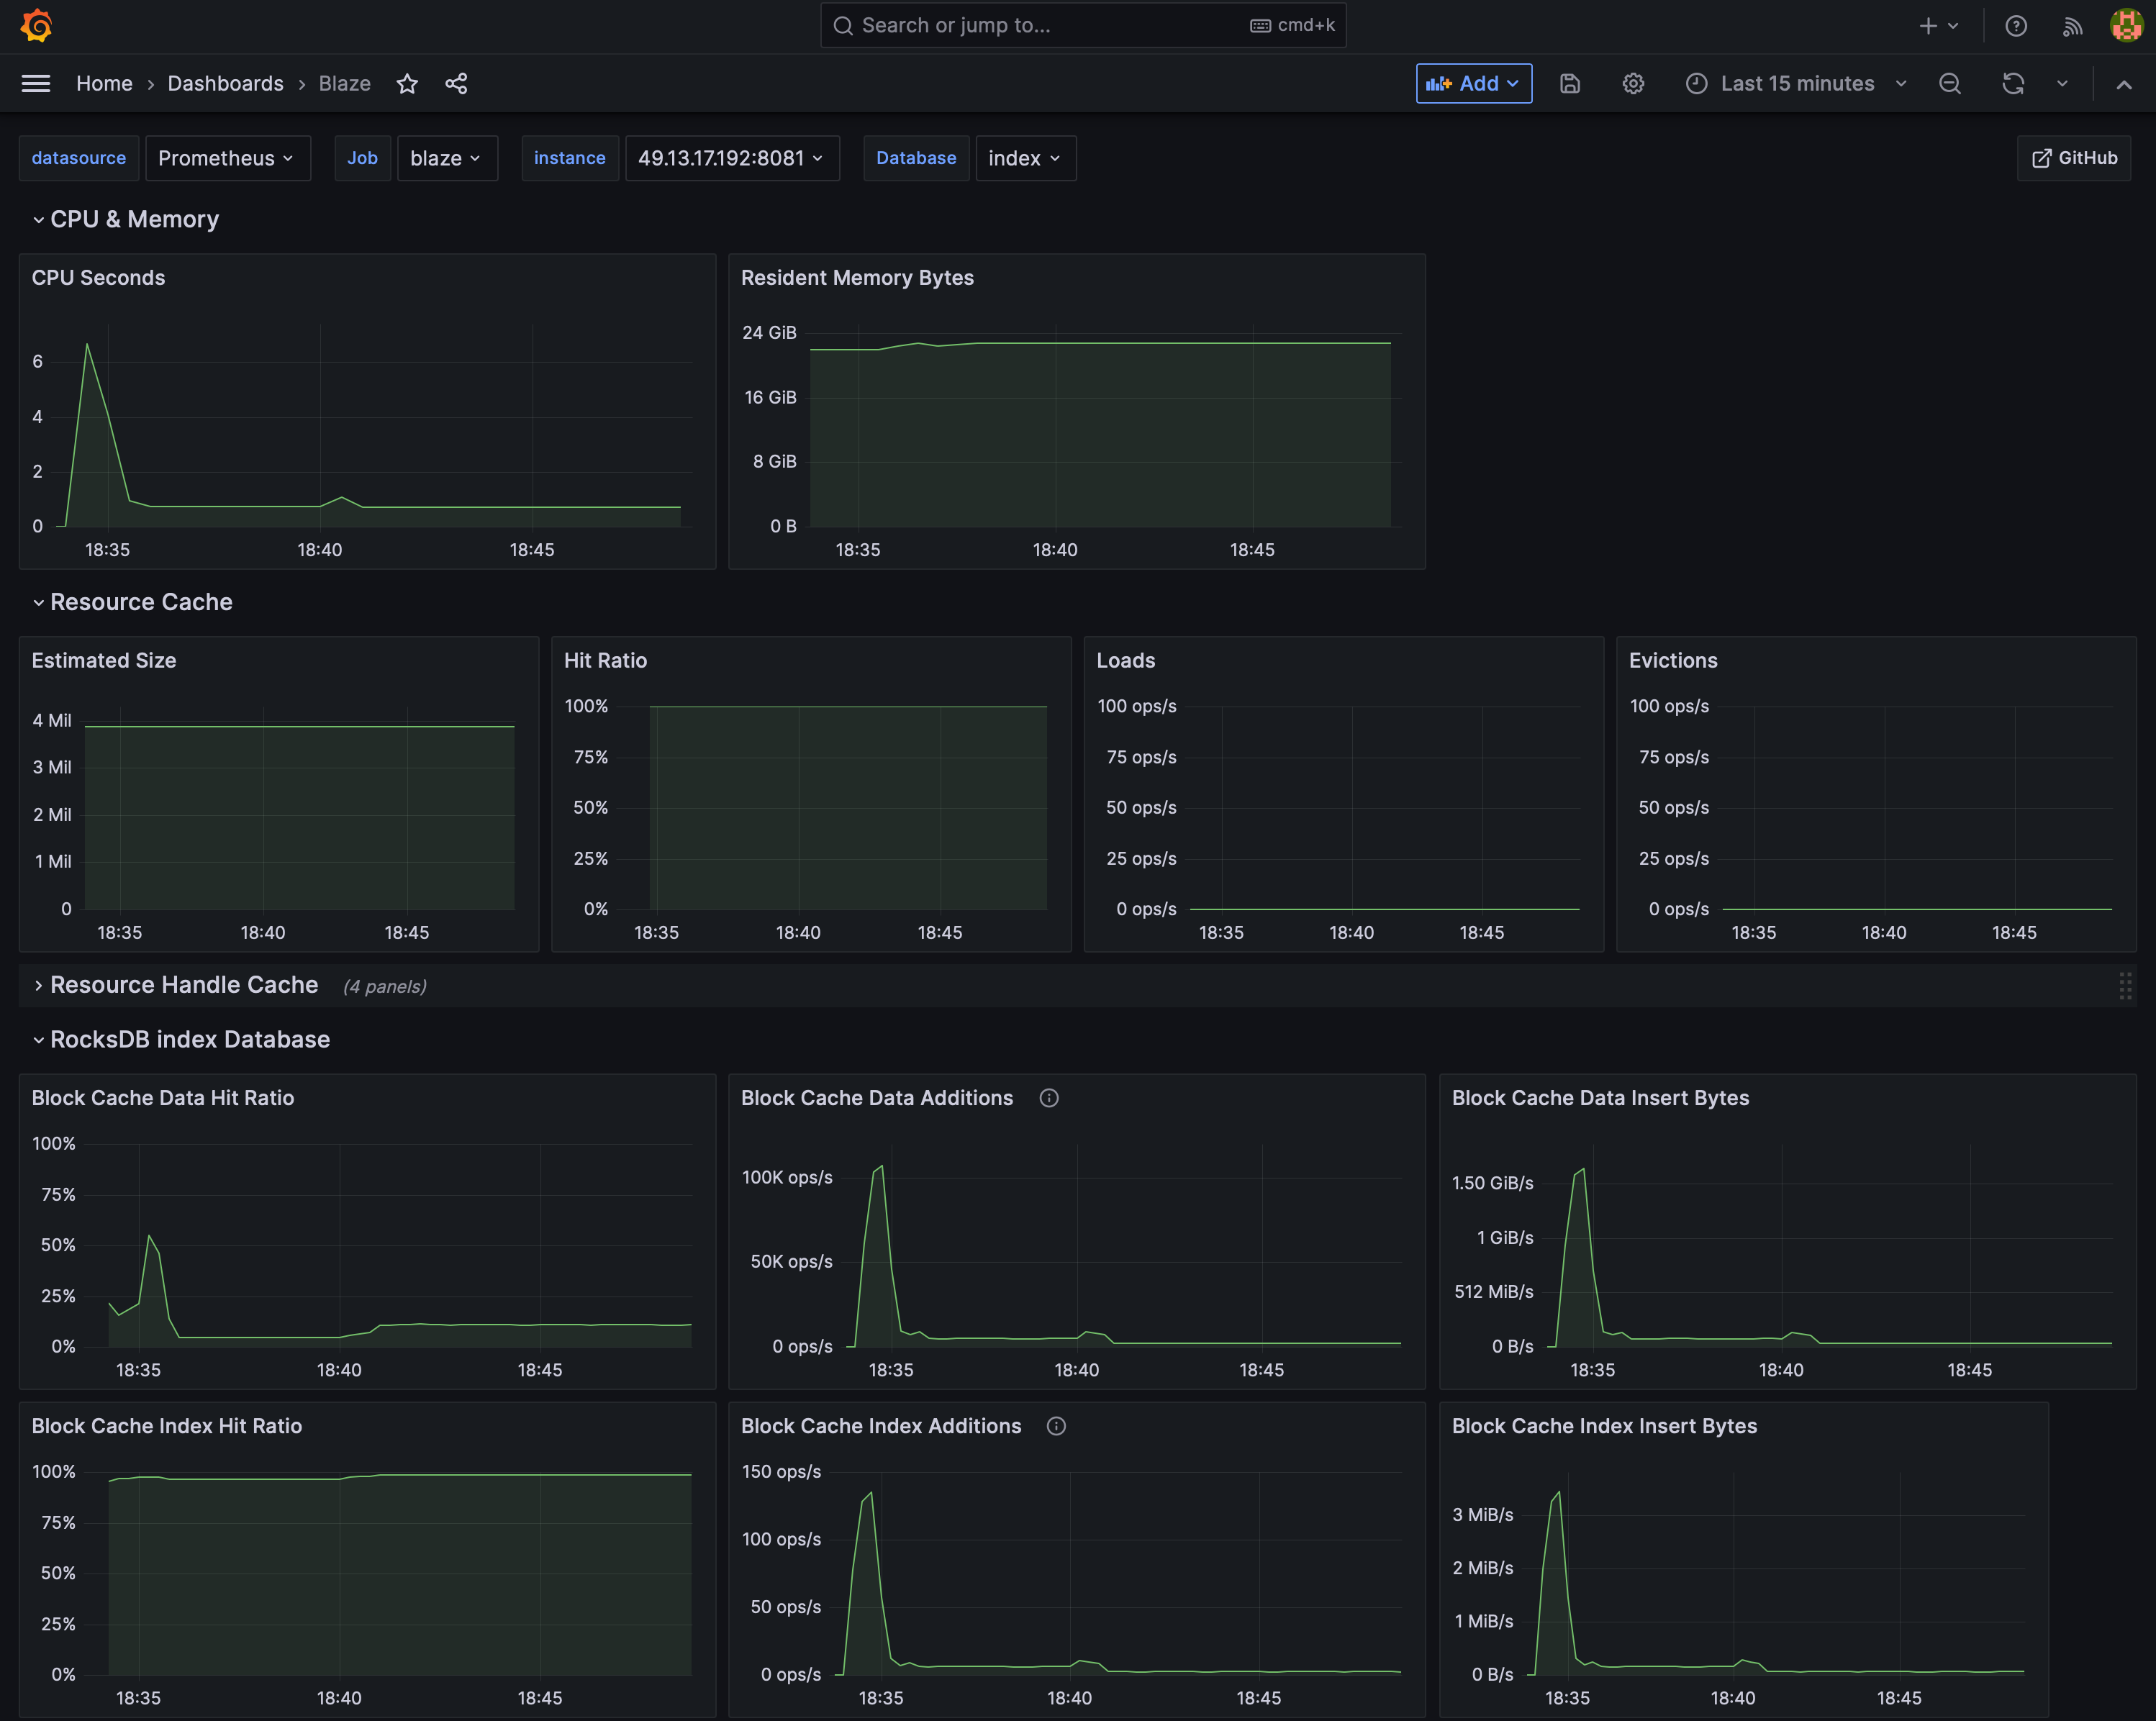
After the Import, the Blaze dashboard should look like this:

Node Exporter for the Server
The Prometheus Node Exporter should be used to gather metrics about the server Blaze is hosted on.